
Looking for Valuant? You are in the right place!

Valuant is now Abrigo, giving you a single source to Manage Risk and Drive Growth

Make yourself at home – we hope you enjoy your new web experience.

Looking for DiCOM? You are in the right place!

DiCOM Software is now part of Abrigo, giving you a single source to Manage Risk and Drive Growth. Make yourself at home – we hope you enjoy your new web experience.

The OCC’s Interest Rate Risk Report: A banker’s guidepost in ALM

Dave Koch
July 31, 2022
Read Time: 0 min

Using the OCC Interest Rate Risk stats for asset/liability management models

Financial institutions can use statistics in the OCC Interest Rate Risk Reports to gauge whether their bank is an outlier on the risk scale.

You might also like this webinar, "Banking in a rising-rate environment."

WATCH


Benchmark your institution

How the recent OCC Interest Rate Risk Report compares to pre-pandemic stats.

I’ve been doing this for a long time now, remembering back to the old Office of Thrift Supervision’s quarterly interest rate risk report. Well, that report is long gone but replaced now by the Office of the Comptroller of the Currency (OCC) Interest Rate Risk Statistics Report, .

The OCC recently published results for 2021 data, and some interesting items pop out when comparing this Interest Rate Risk Statistics Report to the one with 2019 survey results. (Like many things, COVID-19 impacted the release schedule, such that the 2019 results were not reported until the fall of 2020.) This article provides a brief review of major survey findings and variables between 2019 (pre-pandemic) and 2021 (post-pandemic?), based on the comparison.

As I’ll discuss later, financial institutions can use the statistics in these OCC interest rate risk survey reports to gauge whether their bank is an outlier in some way on the risk scale.

Exposures & risk limits

About the OCC Interest Rate Risk Report

To generate the Interest Rate Risk Statistics Report, OCC examiners collect data on how their regulated institutions are managing the interest rate risk variables and subsequent reported risk levels. The results are presented in percentile formats, along with median results. The report provides statistics for different bank populations. The OCC calculated exposures and risk limits for the most commonly modeled target accounts in different interest rate stress scenarios. The OCC also calculated key non-maturity deposit (NMD) assumptions for different NMD types. As the OCC notes, NMD assumptions are one of the most vital assumptions in an interest rate risk model:
NMDs usually represent a large portion of the bank’s funding base and depositors’ behavior can vary considerably. NMD assumptions are needed because changes in deposit pricing and balance are not contractually defined. As a result, models must incorporate behavioral assumptions for deposit accounts including
  • NMD repricing rates, which estimate the change in a deposit’s pricing versus the change in market rates.
  • NMD average lives, which represent the level of deposit runoff over a given time period.
                                                                        OCC Interest Rate Risk Statistics Report Spring 2022

Guidepost for internal model

How financial institutions can use the OCC IRR Report

Using the statistics in the OCC Interest Rate Risk Statistics Report as a guidepost to your internal ALM model values is a recommended activity to show how aggressive or conservative your model may be in the eyes of the regulator. Even if you are not an OCC-regulated institution, this data is the best representation of market exposure data available and is a useful comparison to help identify where you may have opportunities for improvement in modeling or overall financial performance.

The OCC Interest Rate Risk Statistics Report provides tables with statistics on

  • projected changes in 12-month net interest income (NII) in parallel interest rate shock scenarios ranging from –100 basis points to +400 basis points.
  • projected changes in economic value of equity (EVE) in parallel interest rate shock scenarios ranging from –100 basis points to +400 basis points.
  • banks’ policy limits for changes in NII and EVE in parallel interest rate shock scenarios ranging from –100 basis points to +400 basis points.
  • NMD repricing rates and average lives for different account types.

The report also breaks down results by asset size ranges and different charter types.

Let’s review the overall findings.

Stay up to date on asset/liability management best practices and dealing with the current interest-rate environment.

Pre- and post-pandemic

IRR exposures, EVE, and deposit betas

Overall interest rate risk exposures show a stronger positive correlation to rising rate shocks. Median increases in net interest income (earnings at risk) over a 12-month period for a 2% rate shock rose from +3% in 2019 to +7% in 2021. This would make sense given the high levels of liquidity still in the banking system being invested in short-term instruments.

Overall Economic Value of Equity (EVE) moved from slightly liability sensitive with a -1% decline in the +2% shocks in 2019 to a +2% level in 2021. Much of these results are dependent upon the non-maturity deposit assumptions applied to changing rates.

In 2019, median deposit betas (the amount or rate increased applied to deposit prices) were reported at lower levels in the 2021 survey vs. the 2019 survey (see chart).

OCC Interest Rate Risk Report chart showing deposit betas

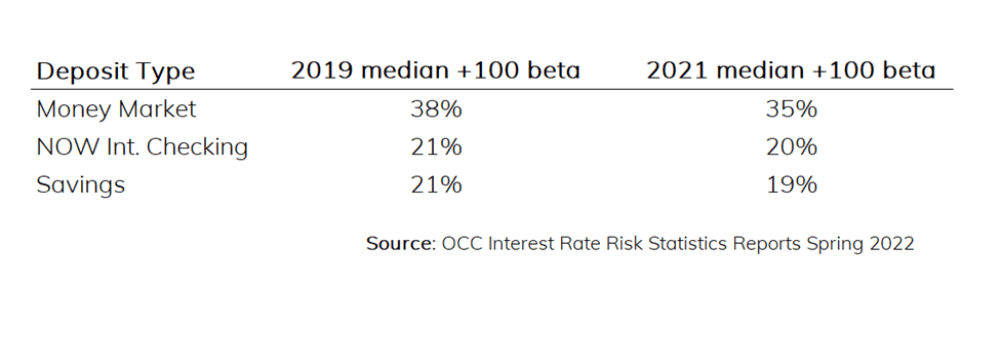
This decline in deposit beta is troubling and may misrepresent earnings at risk as so much of the increased liquidity is sitting in these non-maturity deposit accounts. And while the actual account rates may not move significantly as the Fed raises rates, without a doubt, depositors will shift between different offerings, or there will be promotional pricing that is used to retain funds that will result in a higher cost of funds than the simple “account level” beta. Be sure to be testing out how different surge balance cost assumptions impact your overall margin in the coming 2 years.

The result of lower deposit betas is a longer implied average life of the deposit accounts. Each sector saw slightly longer average lives than in 2019, meaning that the institutions generally think they can avoid paying up as rates rise, and monies will remain on deposit longer. If this is a bet being used to support asset duration extension, careful modeling of stressed assumptions is recommended to ensure stable margins.

When we break down these assumptions by asset size there are some general observations that hold true. Smaller institutions model the deposit beta and average life assumptions with more longevity than the larger institutions. Larger institutions err on the side of higher costs and shorter lives as a measure of potential risk exposure.

Lastly, the report presents policy limits for both earnings- and value-at-risk. Overall, median policy limit levels level for earnings-at-risk limits have widened slightly since 2019 while general EVE limits have remained the same.

As noted earlier, comparing your internal model values to these statistics can be helpful as sort of a
“temperature check” against what regulators have been seeing. Asset/liability management advisors with decades of industry experience can assess how your financial institution’s results compare to the OCC data. They can also provide perspective on how an updated core deposit study can bring about more actionable data like demographics, surge estimates, etc., specific to your institution that will help you plan for moves to remain competitive and profitable.  

Learn how an updated core deposit analysis helps navigate the current environment. Download "6 Reasons to update your core deposit analysis."

keep me informed Download
About the Author

Dave Koch

Director, Advisory Services
Since 1989, Dave has delivered educational programs on Asset/Liability Management and pricing topics to Federal Regulatory Agencies, national and state industry trade groups, Federal Home Loan Banks, and Corporate Credit Unions nationwide.

Full Bio

About Abrigo

Abrigo enables U.S. financial institutions to support their communities through technology that fights financial crime, grows loans and deposits, and optimizes risk. Abrigo's platform centralizes the institution's data, creates a digital user experience, ensures compliance, and delivers efficiency for scale and profitable growth.

Make Big Things Happen.