Looking back to the market rate movements over the past two years we can see in the figure below how different movements combine over time to arrive at the current market conditions.
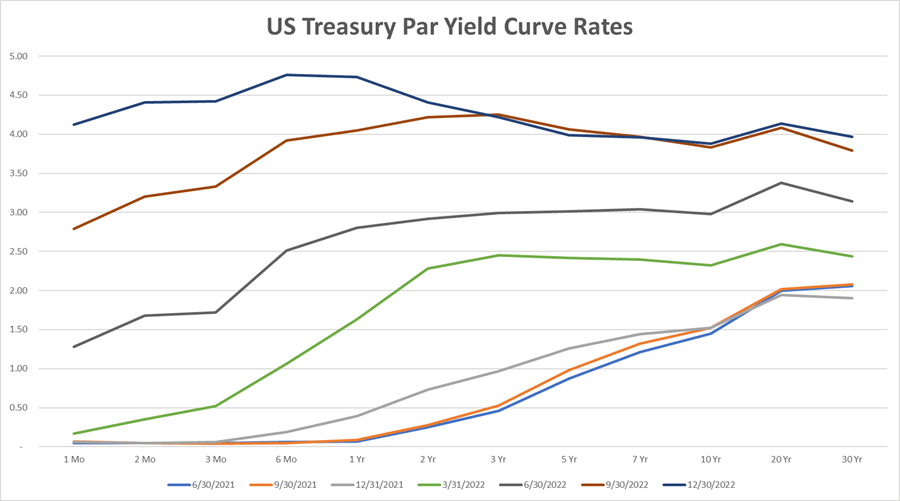
Source: U.S. Department of Treasury
Looking back to the June 2021 rates, we see a positively sloped yield curve, where the spread between the 10 Year vs. 2 Year Treasury stood at 1.4%. As market rates began rising in March of 2022, we experienced a “bear steepener” environment (green line) where there was a sharp rise in long-term rates vs. short-term rates. Moving from March to September or December of 2022, the short-term rates moved much faster than long-term rates – a “bear flattener” movement (gray, rust, or blue lines). However, that movement went too far, resulting in an inverted curve.
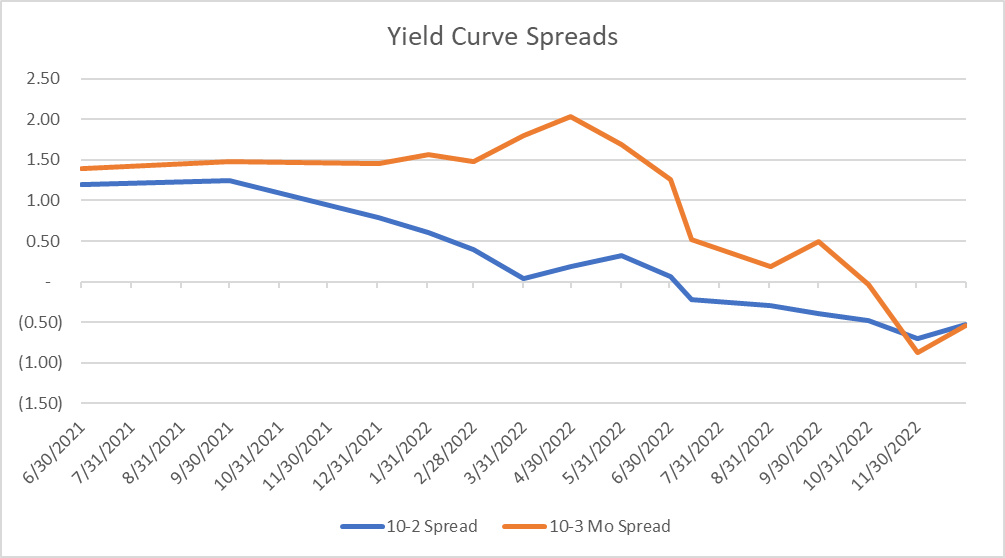
Source: U.S. Department of Treasury
Using the 10 Year-2 Year spread as a gauge, the yield curve inverted in October 2022. During that time the 2 Year Treasury rates were still rising significantly faster than other rates. If we compare the 10 Year – 3 month spread as a gauge, then the inversion began back at the end of Q1 of 2022.
What does this all mean? Well, each of these interest rate types combines with time to create a new set of market conditions.
Variable and unpredictable inputs for market rates
Given where we are now in the cycle, it is plausible to assume a continuation of an inverted curve. The Fed has signaled more rate increases, and the bond markets seem to be retreating in yield, so we would expect another year of inversion. Then in the following year, the Fed may begin to relax rates, and we could see a mild “bull steepener,” but that may not result in a positively sloped curve, but rather a flatter curve in that time horizon.
It is also possible that the Fed will raise short-term rates and long-term rates respond upward as well.
While we attempt to measure the impact of changing market rates on earnings and capital as part of the ALM process, we must recall that these inputs for market rates are variable and unpredictable. Measurements that assume absolute levels or fail to make adjustments to rates and conditions over time will likely misstate the level of risk in overall earnings and equity levels.
It is important to understand how the interest rate cycles are being presented in your ALCO package and how those movements would impact strategies such as deposit pricing and retention, loan structures and rates, etc.
For example, consider if you run a rate scenario where all rates move up by the same amount over the same time frame in an unlikely event. The spreads between short- and long-term rates are likely to compress or expand, making the decisions on investment or funding durations and pricing very different. That is not to say we won’t see rates move for some time where the spreads are fairly constant. But the longer-term realities are not to see extended periods of inverted yield curves as an example. We recommend running the analysis on a short-term basis with continued inversion vs. a return to a flat or positive slope to understand how the shape of the curve impacts overall earnings levels. This is called yield curve risk and is one of the five key risks to identify in the ALCO reporting process.
ALM can be run in a simplistic way or it can be made more complex with better management of key issues like the interest rate forecasts. If you are attempting to quantify risk levels and overall earnings better, then working at understanding and testing these more complicated ideas is a way to improve overall performance.
For insight and assistance on ALM modeling and inputs, consider using ALM advisors.