Financial institutions generate most of their income by lending and investment activities. However, a portion of revenue comes from noninterest income. Noninterest income includes income from such items as overdraft fees, service charges, loan origination fees, and ATM fees. The percentage of institutions’ revenue from this source of income has changed over time, and the composition has also transitioned.
This article looks at trends in growth and composition as well as legal, regulatory, and competitive pressure on noninterest earnings.
Types of noninterest income
Where does noninterest income come from? Noninterest income can be broken down into service charges (and fee income) on deposit accounts, trading revenue, investment banking activities, and the catch-all, other.
Specific examples of the four types of noninterest income include:
- Service charges/fee income:
Account service charges as well as non-sufficient funds (NSF), ATM, safe deposit box, and wire transfer fees. - Trading revenue: Sales on net loans and leases, net real estate sales, other sales.
- Investment banking: Fiduciary activities from trust department services, insurance.
- Other: Miscellaneous income such as rent, data processing services, sale of miscellaneous assets.
It might seem as if all financial institutions would look to noninterest income to make up the difference in what is lacking in interest income as we experience historically low interest rates, but the opposite is true – at least among large banks.
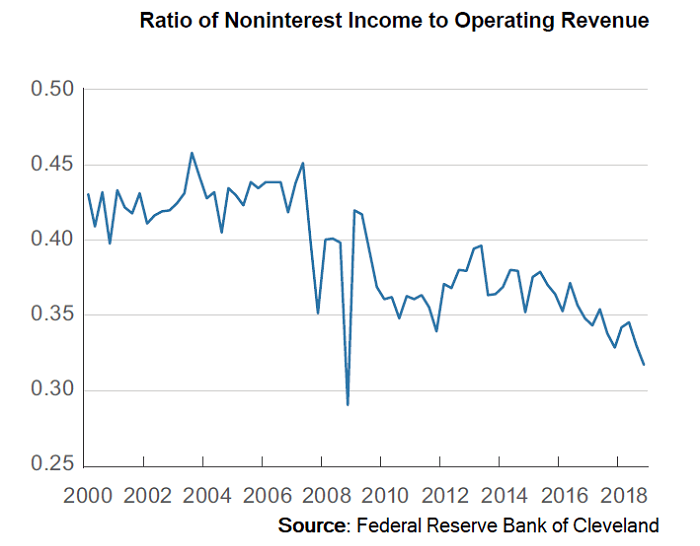 A closer look at the decrease in overall noninterest income reveals an interesting phenomenon – a change in the composition of noninterest income. Noninterest income associated with the housing markets such as securitization, trading, and real estate slowed significantly during the financial crisis and beyond. At the same time, income from investment banking (fiduciary activities) has increased as financial institutions attempt to make up for what is lacking in interest income.
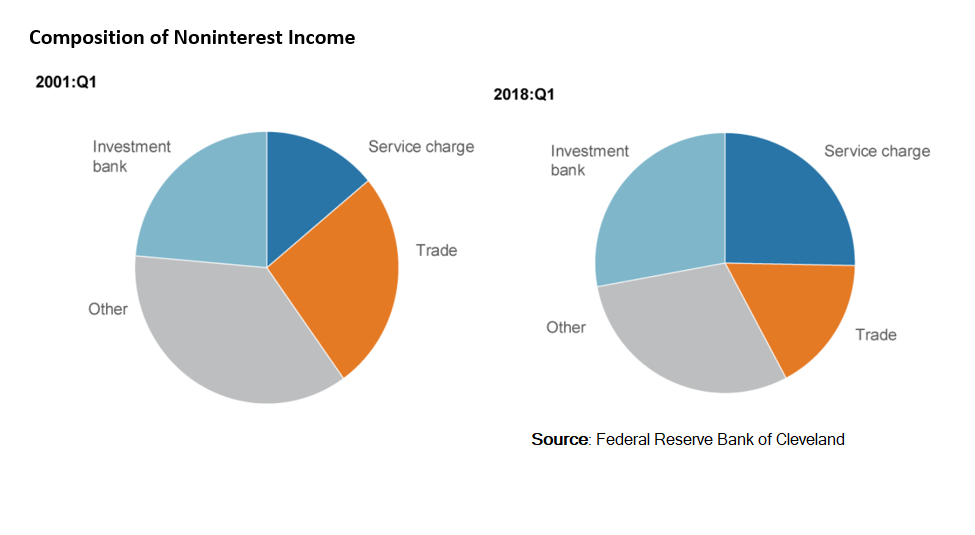
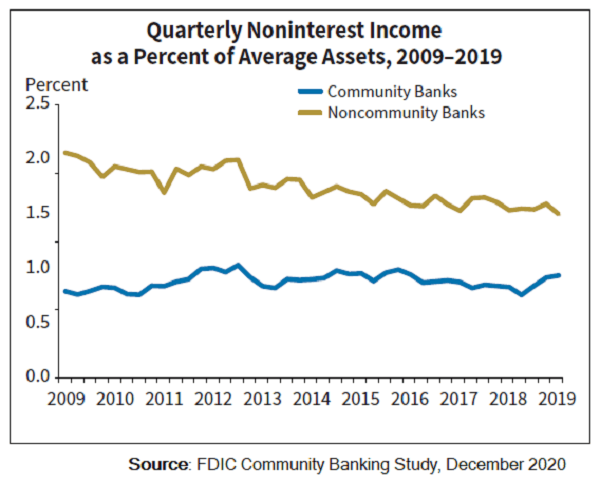 Community banks have seen less volatility in noninterest income over time. Noninterest income drove 20% of community banks' net operating revenue in 2019, down from 22% in 2012, according to a recent FDIC study. At noncommunity banks, share of net operating revenue from noninterest income fell to 34% from 39% in the same timeframe.
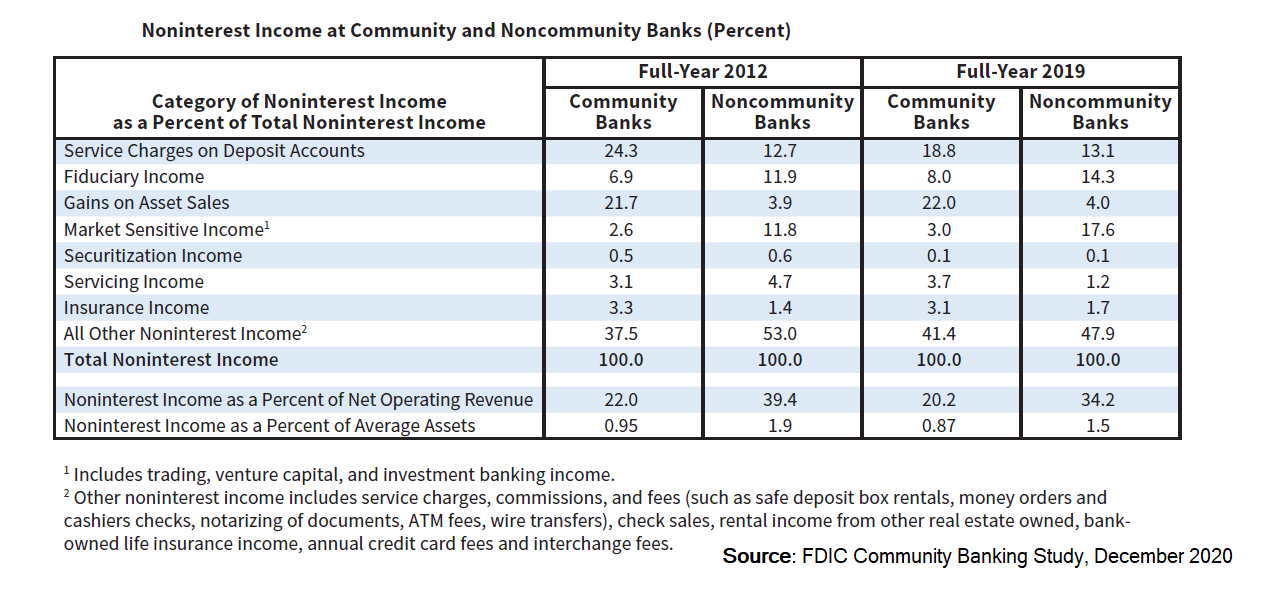 And it appears that community banks’ strategy for noninterest income is on a quite different path as well from larger institutions.